If you need a nonprofit annual report PowerPoint template without starting from a blank deck, the safest free route is to begin with an official Microsoft presentation template and adapt it to nonprofit reporting. As checked in September 2026, Microsoft’s free PowerPoint template gallery includes annual-review styles such as “Impact annual presentation.” You can browse the official collection at Microsoft PowerPoint presentation templates. Template availability and names can change, so use the gallery search if a specific design moves.
This article uses one clearly fictional example throughout: BrightFuture Community Network, an imaginary nonprofit preparing its 2025 annual report. Any program counts, financial figures, names, and outcomes mentioned below are examples only. They are included to show how to turn a generic slide deck into a useful annual report, not as claims about a real organization.
What a nonprofit annual report PowerPoint should accomplish
A good annual report deck is not just a prettier version of a spreadsheet. It should help a donor, board member, volunteer, partner, or community member understand three things quickly: what the organization tried to do, what happened during the year, and how resources supported that work.
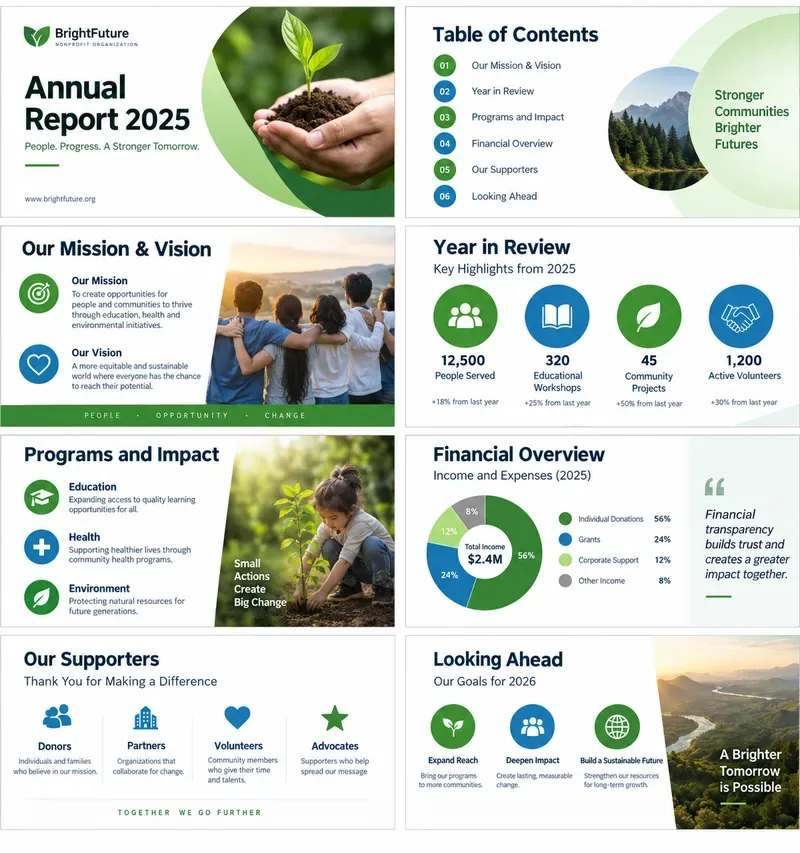
For the fictional BrightFuture Community Network, the presentation might need to explain that the organization ran education, health, and environmental programs, served 12,500 people, worked with 1,200 volunteers, and managed $2.4 million in annual income. Those numbers are deliberately fictional. In a real report, every figure should come from a documented source such as the organization’s approved program data, finance records, grant reports, or audited statements where applicable.
Illustrative nonprofit annual report slide family with fictional branding and sample metrics. Replace every number, statement, image, and logo with verified information from your own organization.
Free download option: start with Microsoft’s official templates
Microsoft currently provides free presentation templates that can be customized in PowerPoint. The official gallery includes annual-review and impact-oriented designs that can be repurposed for a nonprofit annual report. This is a better starting point than downloading an unknown file from an unverified template site, especially if your organization has security rules for Office files.
If your team wants a reusable template rather than a one-time presentation, PowerPoint’s standard template format is .potx. Microsoft documents how to create and save a presentation as a PowerPoint template in its official template support guide. A .potx file can preserve your slide master, layouts, placeholders, colors, and fonts for future annual reports.
There is one important limitation for browser-only teams. Microsoft states that PowerPoint for the web can use many built-in templates, but it cannot directly open a custom .potx file. Microsoft recommends opening the .potx in desktop PowerPoint first and saving it as a .pptx if you need to continue in the browser. See Microsoft’s guidance for templates in PowerPoint for the web.
A practical slide structure for the fictional BrightFuture report
The exact number of slides depends on the audience. A concise public annual report might work well in roughly 8 to 12 slides, while a board or funder version may need additional detail. For BrightFuture, the following structure keeps the story clear without turning the deck into a data dump.
Slide
Purpose
BrightFuture example
1. Cover
Identify the organization, reporting period, and theme.
“Annual Report 2025” with a short line about community impact.
2. Mission and year in context
Remind the reader why the organization exists and what shaped the year.
A brief mission statement plus two sentences on the year’s priorities.
3. Year at a glance
Surface a few high-value metrics.
People served, volunteers, workshops, and community projects.
4–5. Programs and outcomes
Show what the organization actually did and what changed.
Education, health, and environmental programs with verified results.
6. Human story
Add context that metrics alone cannot provide.
A consented participant or volunteer story, anonymized when necessary.
7. Financial overview
Explain where money came from and how it was used.
Simple revenue and expense categories that reconcile to approved records.
8. Supporters and partners
Recognize contributors according to organizational policy.
Donors, volunteers, partner organizations, and sponsors.
9. Governance or leadership
Provide accountability and organizational context.
Board and executive leadership, if appropriate for the public report.
10. Looking ahead
Connect the annual report to the next year.
Three measurable priorities for 2026 and a clear call to action.
Use the fictional example to decide what belongs on each slide
Impact slides should answer more than “how many?”
Suppose BrightFuture says it delivered 320 educational workshops. That is an activity count, not automatically an outcome. A stronger slide might pair the activity with a verified result, such as participant completion, a measured skill gain, a referral outcome, or another indicator the organization already tracks. If the nonprofit does not have a defensible outcome measure, it is better to report the activity accurately than to invent a stronger-sounding result.
Keep the denominator visible when percentages could mislead. “78% of 240 survey respondents reported increased confidence” is more informative than a large “78%” with no context. Also state the measurement period when it matters.
Financial slides should simplify, not distort
For the fictional BrightFuture example, imagine total annual income of $2.4 million. A public-facing slide could group sources into individual donations, grants, corporate support, and other income. A companion expense chart could show program services, administration, and fundraising if those categories match the organization’s accounting and reporting approach.
Do not label figures “audited” unless they come from audited financial statements, and do not force internal management categories to match a public graphic if the mapping is inaccurate. The annual report is a communication product, but the financial section still needs to reconcile to records that your finance team can defend.
Do not confuse the annual report with Form 990
For U.S. tax-exempt organizations, a public-facing annual report is not a substitute for required federal filings. The IRS explains that many tax-exempt organizations must file an annual information return or notice, including forms in the Form 990 series, unless an exception applies. The IRS also notes that Form 990 is used to collect information about activities, finances, governance, and compliance and can be used by organizations to share information with the public. See the IRS Form 990 resources and tools.
Many exempt-organization returns are also subject to public inspection requirements. The IRS describes those requirements on its public disclosure guidance. That means your annual report should not contradict information that stakeholders can verify elsewhere. Filing obligations vary by organization type and jurisdiction, so use qualified legal or tax advice when necessary rather than treating a PowerPoint template as a compliance checklist.
Make the template look like your nonprofit, not like a template
Once you pick a free deck, replace generic design decisions with your organization’s real visual system. Use the official logo, approved brand colors, and consistent type styles. If your nonprofit has no formal brand guide, define a restrained mini-system: one primary color, one accent color, one heading font, one body font, and a consistent approach to photography.
For BrightFuture, that might mean a deep green primary color, a blue accent, large section headings, and photographs that show programs in context. In a real nonprofit report, photo consent and privacy rules matter. Avoid using identifiable participant images simply because they make a slide look more emotional. If a program serves children, patients, survivors, or other vulnerable populations, your organization’s consent and safeguarding policies should drive image selection.
Build accessibility into the deck before sharing it
Annual reports are often distributed as PowerPoint files, PDFs, or online presentations, so accessibility should be part of the template rather than an afterthought. Microsoft recommends practices such as adding alternative text to meaningful images, using accessible slide designs, considering color and fonts, and running the Accessibility Checker. The current guidance is available in Microsoft’s PowerPoint accessibility documentation.
For the BrightFuture example, a chart should not rely on green versus blue alone to communicate meaning. Add clear labels, use sufficient contrast, and give the chart a descriptive title. Decorative images should not compete with the information that a screen reader user needs.
Common mistakes to avoid when customizing a free nonprofit annual report template
Leaving sample numbers in the file. Replace every placeholder metric, date, percentage, financial figure, and chart label before publication.
Mixing outputs and outcomes. “Meals distributed” and “households reporting improved food security” describe different things; label each correctly.
Publishing charts that do not reconcile. The totals in graphics should match the approved source data after rounding.
Overloading each slide. A slide deck is not a substitute for a detailed financial statement or program evaluation report. Link to deeper materials when readers need them.
Using unsupported claims. Words such as “proven,” “best,” “transformative,” or “industry-leading” require evidence. Prefer specific, measurable descriptions.
Forgetting the reporting period. Every annual report should make the covered fiscal or calendar year unmistakable.
Treating donor recognition casually. Follow the organization’s privacy preferences and recognition policy before publishing names or contribution levels.
Should you save the finished file as PPTX, POTX, or PDF?
Use .pptx when you want a normal editable presentation that staff can open and update. Use .potx when the goal is a reusable PowerPoint template for future annual reports; desktop PowerPoint is the practical route for creating and managing this format. Use PDF for a fixed distribution copy when you want the layout to remain stable across devices, but keep the editable PowerPoint source for future revisions.
A practical workflow for BrightFuture would be to maintain one internal .potx master, create a fresh .pptx for each reporting year, and export an approved PDF for public distribution. That separation reduces the risk of overwriting the master or accidentally publishing placeholder material.
Final checklist before you publish
Confirm the report year, organization name, logo, and contact information.
Trace each impact metric to a documented source and record the measurement period.
Reconcile financial charts to approved finance data.
Verify spelling of partner, board, donor, and staff names that are intended for publication.
Check photo permissions and remove sensitive or unnecessary personal information.
Run PowerPoint’s Accessibility Checker and review reading order, alt text, contrast, and chart labels.
Remove hidden comments, stale notes, unused slides, and sample content from the template.
Have at least one program owner and one finance or operations reviewer sign off on the final version.
A free template can save hours of formatting, but the value of a nonprofit annual report comes from verified content and clear choices about what matters. Use the template as a framework, not as evidence. The fictional BrightFuture example works because each slide has a defined purpose: mission, activities, outcomes, finances, accountability, supporters, and what comes next. Apply the same logic to your organization, and the presentation will feel intentional rather than generic.