Home
» AI Agents
»
Simple Inventory Count Sheet Template for Retail Stores: A Practical Excel Layout
Simple Inventory Count Sheet Template for Retail Stores: A Practical Excel Layout
A simple inventory count sheet works best when it answers three questions without making staff hunt through the workbook: what should be on the shelf, what was actually counted, and what needs to be checked again? For many small retail stores, an Excel sheet with clear item identifiers, locations, expected quantities, physical counts, and variances is enough for a controlled cycle count or a scheduled stocktake.
Throughout this article, we will use Maple Street Goods, a fictional neighborhood retailer, as a clearly labeled hypothetical example. The store, product counts, discrepancies, and workflow described below are illustrative only; they are not test results, customer claims, or measured business outcomes.
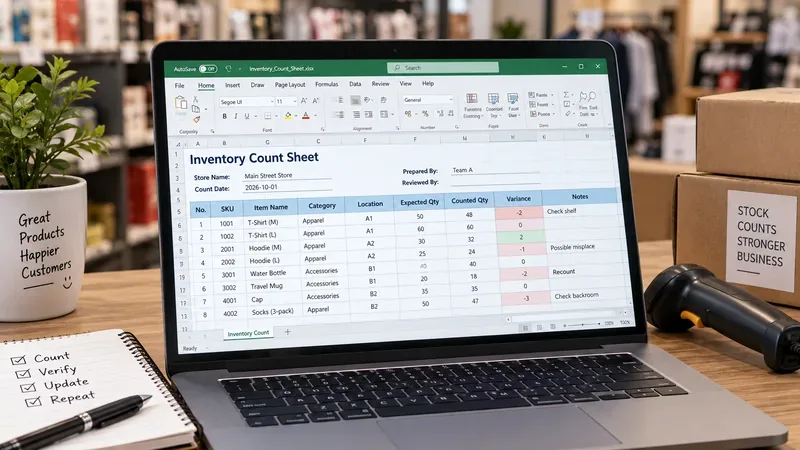
A retail inventory count setup with an Excel count sheet, barcode scanner, stock boxes, and a checklist for count, verify, update, and repeat.
What a good inventory count sheet should accomplish
The most useful template is not the one with the most columns. It is the one that lets a counter identify the correct product, record a quantity once, and immediately see whether a discrepancy deserves attention. For a small store, the sheet should support a repeatable process rather than attempt to replace a full inventory-management system.
For our hypothetical Maple Street Goods example, assume the manager wants to count apparel and accessories after closing. The store already has an expected quantity exported from its point-of-sale system. The Excel workbook is used only for the physical count and reconciliation. That distinction matters: the workbook is a counting and review layer, not necessarily the system of record.
Recommended columns for a simple retail inventory count template
A practical starting layout is shown below. You can remove optional columns if they slow down the count.
Column
Purpose
Example
SKU
Unique product identifier used to avoid confusing similar items
TS-1002
Item Name
Plain-language description for the counter
Classic T-Shirt, Large
Category
Groups products for filtering and review
Apparel
Location
Shows where the item should be counted
Aisle A / Shelf 2
Expected Qty
Quantity recorded before the physical count
60
Counted Qty
Quantity physically counted
58
Variance
Difference between counted and expected quantity
-2
Recount Qty
Optional second count for exceptions
60
Final Qty
Approved quantity after review
60
Notes
Reason or follow-up information
Two units found on display rack
Counted By
Identifies who performed the count
Jordan
If your goal is a fast one-person count, you can stop at SKU, Item Name, Location, Expected Qty, Counted Qty, Variance, and Notes. Add Recount Qty, Final Qty, and Counted By when more than one employee participates or when the store needs a clearer review trail.
Use one simple variance formula
If Expected Qty is in column E and Counted Qty is in column F, the basic variance formula in row 2 is =F2-E2. A negative result means the physical count is below the expected quantity; a positive result means more units were found than expected.
If you convert the range to an Excel table, the same idea can be expressed with a structured reference such as =[@[Counted Qty]]-[@[Expected Qty]]. Microsoft documents that Excel tables can use column names in formulas and that structured references adjust as table data changes. See Microsoft Support on structured references in Excel tables.
In the Maple Street Goods example, an expected quantity of 60 and a first count of 58 produces a variance of -2. That number should not automatically become an inventory adjustment. It is a signal to investigate. A recount might reveal that two units were on a display fixture rather than the primary shelf.
Turn the list into an Excel table
For most retail count sheets, formatting the range as an Excel table is useful because headers remain logically tied to the data, filters are added to the columns, and formulas are easier to maintain as rows are added. Microsoft’s current instructions for supported Excel versions describe selecting the data and using Home > Format as Table. See Microsoft Support: Create and format tables.
This is especially helpful in the fictional store if the manager wants to filter the sheet to only “Apparel,” only “Aisle A,” or only rows with a nonzero variance. Microsoft notes that filters in a table can temporarily hide rows that do not match the selected criteria without rearranging the source data. See Microsoft Support: Filter data in a range or table.
Keep data entry controlled, not complicated
Physical counts often fail because of input mistakes rather than complex spreadsheet logic. For example, a staff member might type “5O” with the letter O instead of 50, enter a negative number accidentally, or use inconsistent category names.
Excel data validation can restrict the values accepted in a cell, including whole numbers, dates, and list-based choices. For a count sheet, consider allowing only whole numbers greater than or equal to zero in Counted Qty and Recount Qty. You can also use a list for Category or Count Status when the valid choices are known in advance. Microsoft describes these options in Apply data validation to cells.
Do not over-constrain the Notes field. The person counting may need to record something unexpected, such as “damaged unit in returns bin” or “item found under alternate display.” Free-text notes are often more useful than forcing every exception into a predefined list.
Make discrepancies easy to review
A count sheet becomes more useful after the counting is finished. At that point, the manager should be able to isolate the rows that need attention. A simple approach is to filter Variance so that zero values are hidden. You may also apply conditional formatting so nonzero variances stand out visually, but the underlying number should remain visible and understandable without color.
In our hypothetical example, Maple Street Goods might finish the first pass with 12 nonzero variances. That number is purely illustrative. The manager would filter to those rows, assign a recount, record a second quantity, and approve a final quantity only after resolving obvious location or counting issues.
For longer sheets, freezing the header row can make the workbook easier to use while scrolling. Microsoft documents Freeze Panes under the View tab and explains that it keeps selected rows or columns visible while you move elsewhere in the worksheet. See Microsoft Support: Freeze panes to lock rows and columns.
A practical counting workflow for the fictional store
Here is how the template could be used at Maple Street Goods without turning the spreadsheet into a complicated application:
Prepare the list. Export or enter each SKU, item name, category, location, and expected quantity before the count begins.
Assign count areas. Divide shelves, racks, or stockroom zones so employees do not count the same location twice.
Record the physical quantity. Enter only what is physically present in the assigned location. If the same SKU appears in several places, either use separate location rows or establish a clear rule for combining the quantities.
Review variances. Filter the Variance column to show nonzero results.
Recount exceptions. Revisit only the discrepant items unless the store’s policy requires a broader second count.
Approve the final number. Record the reconciled quantity and a short note when the reason is known.
Update the system of record. Make inventory adjustments in the store’s POS, ERP, or inventory platform according to the business’s own controls.
The important boundary is step seven: Excel can help organize the evidence, but it does not automatically make a quantity change valid. The store still needs its own approval and adjustment process.
Should expected quantities be hidden during the count?
That depends on the purpose of the count. Showing Expected Qty makes the sheet convenient and supports quick reconciliation, but it may also influence the counter. For a more independent physical count, you can hide the expected quantity from the person doing the first pass and reveal it only during review.
For example, Maple Street Goods could print or share a “blind count” view containing SKU, Item Name, Location, and Counted Qty, while the manager keeps Expected Qty and Variance on a review sheet. This adds process discipline but also requires more coordination. A very small store with one trusted counter may reasonably choose the simpler visible-expected-quantity approach.
When this Excel template is a good fit
A simple inventory count sheet is well suited to a small shop, boutique, pop-up store, stockroom, or department that needs a controlled physical count without building a custom system. It is particularly practical when the product list can be prepared in advance and the number of simultaneous counters is modest.
It can also work for cycle counting: instead of counting every SKU at once, the store can filter by category, location, or another selection rule and count a manageable subset on a recurring schedule.
When to move beyond a spreadsheet
Excel has clear limits. A workbook is not a substitute for purpose-built inventory software when the operation needs continuous multi-location synchronization, serial- or lot-number tracking, expiration controls, complex receiving and transfer workflows, barcode-driven transactions tied directly to stock balances, role-based approvals, or a detailed audit history across many users.
Similarly, a large workbook shared by several counters can create coordination problems if people overwrite data, work from different copies, or are unsure which version is authoritative. If those issues become routine, the right improvement is usually process or system design, not another formula.
Quality checklist before using the template
Every sellable item has a stable SKU or other unique identifier.
Locations are specific enough that two counters interpret them the same way.
Expected Qty is captured at a defined point in time.
Counted Qty accepts only appropriate numeric values.
Variance is calculated consistently as counted minus expected.
Nonzero variances can be filtered quickly.
There is a clear rule for recounting and approving exceptions.
The workbook has an owner and a clear final version.
Inventory adjustments happen in the approved system of record, not merely in the count sheet.
Bottom line
A retail inventory count sheet does not need to be elaborate. Start with reliable product identifiers, a location, expected quantity, physical count, variance, and notes. Add recount and approval columns only when they improve control. Use Excel tables, filters, data validation, and frozen headers to make the sheet easier to manage, but keep the workbook focused on the counting task.
The fictional Maple Street Goods example shows the intended principle: the spreadsheet should make discrepancies visible and reviewable, while the store’s real inventory system remains the place where approved stock changes are recorded. That separation keeps a simple Excel template useful without pretending it can handle every inventory-management requirement.