If you need a better way to track prospects but are not ready to buy a CRM, Excel can be a useful intermediate system. The key is to treat the workbook as a small operating process, not just a contact list. That means standard fields, controlled statuses, clear ownership, scheduled follow-ups, and a lightweight review routine.
This guide reflects Microsoft support documentation available in September 2026. It focuses on choices and tradeoffs rather than pretending a spreadsheet is a permanent replacement for customer relationship management software. Excel is strongest when your sales process is still simple and changing. A CRM becomes more valuable when the cost of manual coordination, inconsistent data, or missed activity is greater than the cost and effort of adopting a dedicated system.
Start with the decision: what should the spreadsheet actually do?
Before adding formulas, decide what decisions the tracker must support. For a small team, the useful questions are usually straightforward: Who owns this lead? What stage is it in? When should someone follow up? What is the potential value? Where did the lead come from? What changed since the last review?
A good first version should answer those questions without asking people to maintain dozens of fields. Start with the minimum set below and add columns only when they change a decision or a workflow.
| Field | Why it matters | Keep it simple by |
|---|
| Lead ID | Provides a stable reference for each lead | Using a unique ID rather than relying on a name |
| Company | Identifies the account or organization | Using one canonical company name |
| Contact | Identifies the person you are speaking with | Keeping one primary contact in the first version |
| Email | Provides a practical duplicate check and contact field | Standardizing spelling and removing obvious duplicates |
| Source | Shows where leads originate | Using a short controlled list such as Referral, Website, Event, Partner |
| Stage | Shows where the lead is in your process | Using five to seven stages that have clear definitions |
| Owner | Makes responsibility explicit | Assigning exactly one current owner |
| Next Follow-Up | Drives the next action | Using a real Excel date rather than free-form text |
| Estimated Value | Supports basic pipeline planning | Leaving it blank when value is genuinely unknown |
| Notes | Captures concise context | Recording only what the next person needs to know |
Resist the temptation to copy every field you see in a CRM demo. Extra fields create maintenance cost. A spreadsheet with ten consistently maintained columns is usually more useful than one with forty mostly empty columns.
Step 1: create one row per lead and one column per field
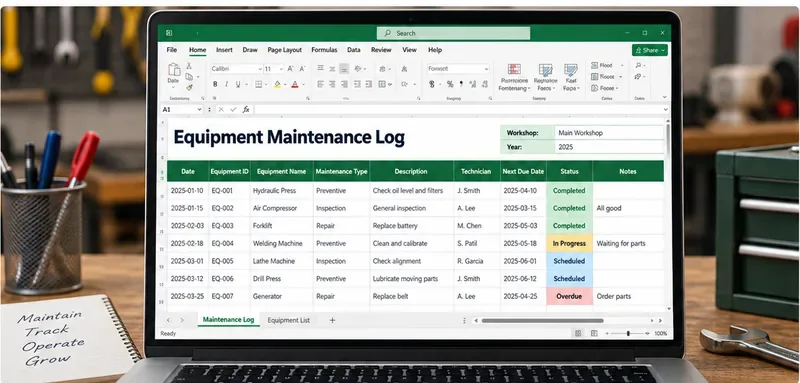
Create a sheet named Leads. Put field names in the first row and keep the dataset rectangular: one header row, one record per row, and no merged cells inside the data area. This layout matters because Excel features such as tables, filters, formulas, and PivotTables work best with column-based data.
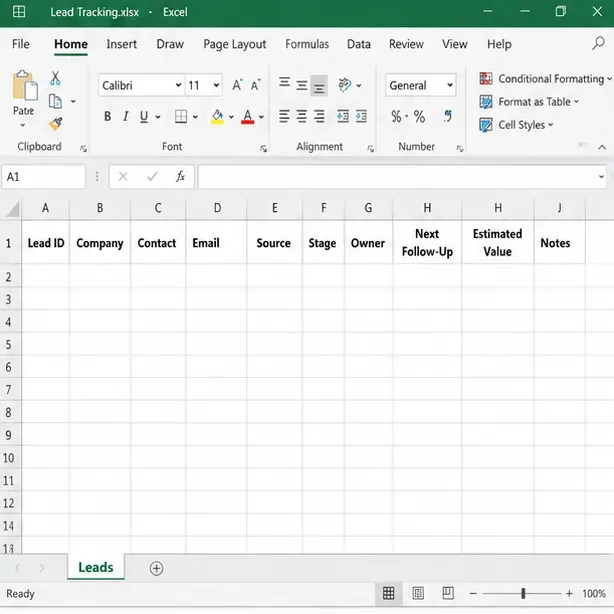
Example worksheet with a deliberately small set of lead-tracking fields.
If your sales motion involves several contacts per company, separate account and contact tracking eventually becomes useful. For the first version, however, do not create a relational model unless you actually need it. Complexity introduced too early can make the spreadsheet harder to maintain than the problem it is supposed to solve.
Step 2: convert the range into an Excel Table
Enter a few sample rows, select a cell in the data, and choose Home > Format as Table. Confirm that the range includes headers. Microsoft documents Excel Tables as a way to group and analyze related data, and they also give you built-in filter controls and structured references for formulas. See Microsoft Support: Create and format tables.
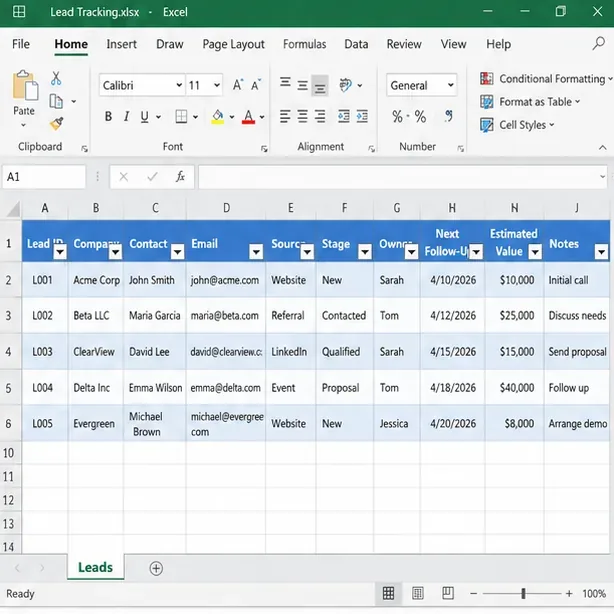
Formatting the range as a Table makes sorting, filtering, and expanding the lead list easier to manage.
Tradeoff: an Excel Table is flexible and fast to change, but that flexibility is also a governance risk. Anyone with edit access can potentially change fields, formulas, or definitions. If your team needs tightly controlled schemas, role-based permissions, and a permanent record of activities, those are signs that a CRM may be a better fit.
Step 3: replace free-text statuses with dropdowns
The fastest way to make a spreadsheet unreliable is to let everyone type their own version of the same status. “Qualified,” “Qual,” “qualified lead,” and “Ready” may mean the same thing to a human but behave like different categories in reports.
Create a small Lists sheet containing your allowed values. For example, a simple Stage list could be New, Contacted, Qualified, Proposal, Won, and Lost. Then select the Stage cells and use Data > Data Validation > List. Microsoft confirms that data validation can restrict entries and create dropdown lists. See Microsoft Support: Apply data validation to cells.
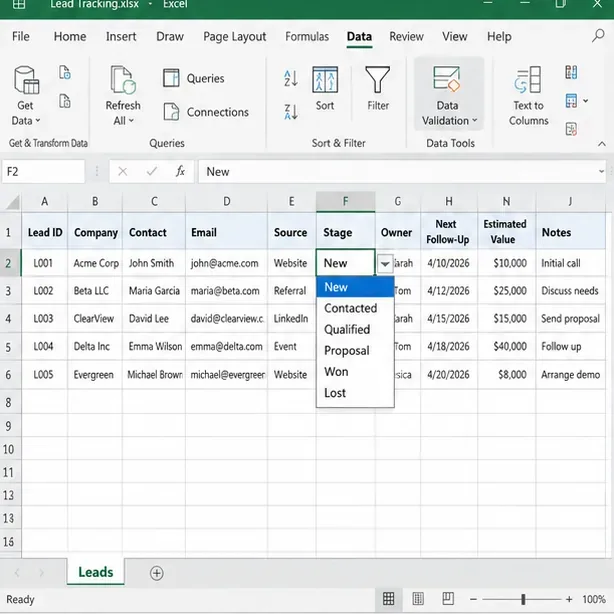
A controlled Stage dropdown prevents small wording differences from fragmenting your pipeline report.
Use the same approach for Source and Owner. Keep the list short enough that a salesperson can choose the right value without stopping to interpret subtle distinctions. If people routinely ask which stage to choose, the problem is not Excel—it is the stage definition.
Step 4: make the working view easy to scan
Lead trackers become difficult to use when the list grows beyond the visible screen. Keep the header visible while scrolling with View > Freeze Panes. Microsoft explains that Freeze Panes locks rows above and columns to the left of the selected cell. See Microsoft Support: Freeze panes to lock rows and columns.
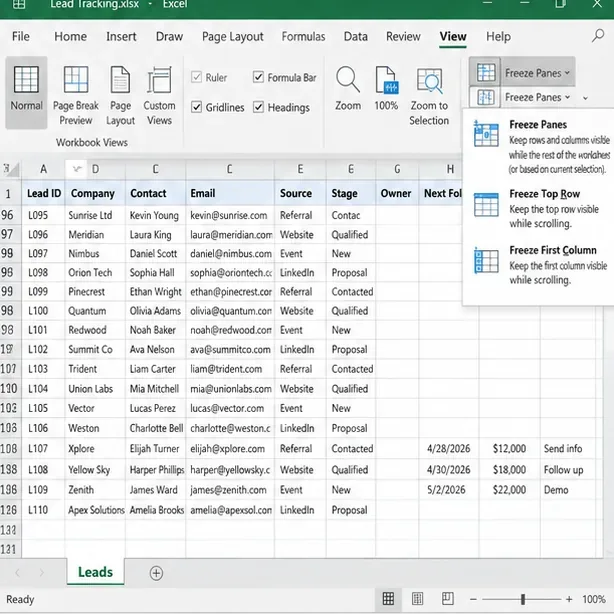
Keeping headers visible makes a longer lead list easier to review without losing the meaning of each column.
Filters are equally important. A salesperson should be able to show only their leads, only open stages, or only follow-ups due this week. A manager may filter by owner or source. If the tracker requires many custom views for different roles, that is another sign you are moving beyond the natural comfort zone of a single worksheet.
Step 5: use conditional formatting for exceptions, not decoration
Conditional formatting is most useful when it highlights a problem that needs action. Two practical rules are overdue follow-ups and possible duplicate email addresses. Microsoft documents conditional formatting for duplicate values and formula-based rules. See Microsoft Support: Use conditional formatting to highlight information in Excel.
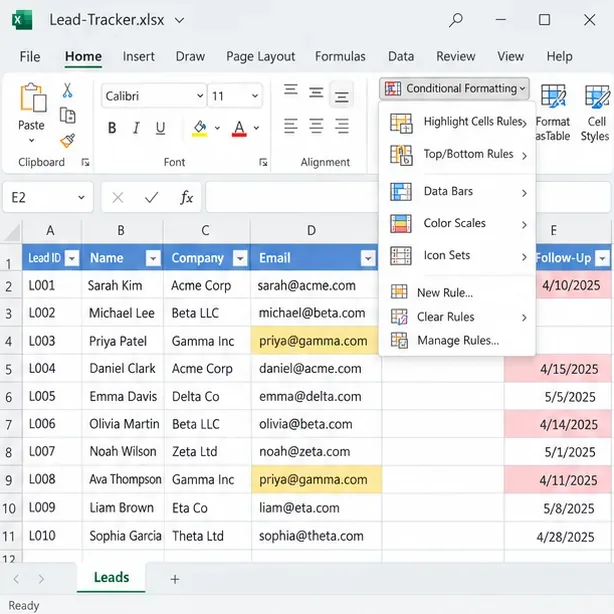
Use visual emphasis for exceptions such as duplicate contact details or follow-ups that need attention.
Avoid assigning a different color to every stage unless the colors actually improve a decision. Too much formatting turns the sheet into visual noise. The goal is to surface exceptions, not to recreate a dashboard in every row.
Step 6: add a simple follow-up status formula
You can make the next-action column more useful by adding a calculated Follow-Up Status column. In an Excel Table, a straightforward formula is:
=IF([@[Next Follow-Up]]="","",IF([@[Next Follow-Up]]<TODAY(),"Overdue",IF([@[Next Follow-Up]]=TODAY(),"Due today","Upcoming")))
This deliberately answers only one question: is the follow-up late, due today, or still upcoming? Do not turn the formula into a miniature workflow engine. If you need automated reminders, multi-step sequences, email logging, or automatic assignment, dedicated sales software is better suited to that job.
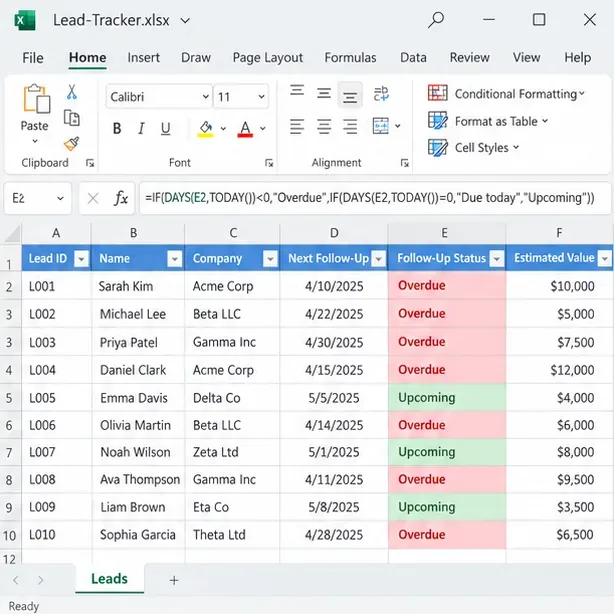
A compact status formula can turn a date column into a practical daily action list.
You can also calculate a weighted pipeline value, but only if your team has agreed on meaningful stage probabilities. Multiplying a guessed probability by deal value can create false precision. If probabilities are not based on a stable process or historical evidence, report total estimated value by stage instead.
Step 7: create a small management summary with a PivotTable
When the raw table is clean, create a separate Summary sheet and insert a PivotTable. Useful first views include lead count by Stage, lead count by Owner, estimated value by Stage, and lead count by Source. Microsoft describes PivotTables as a way to calculate, summarize, and analyze worksheet data to reveal comparisons, patterns, and trends. See Microsoft Support: Create a PivotTable to analyze worksheet data.
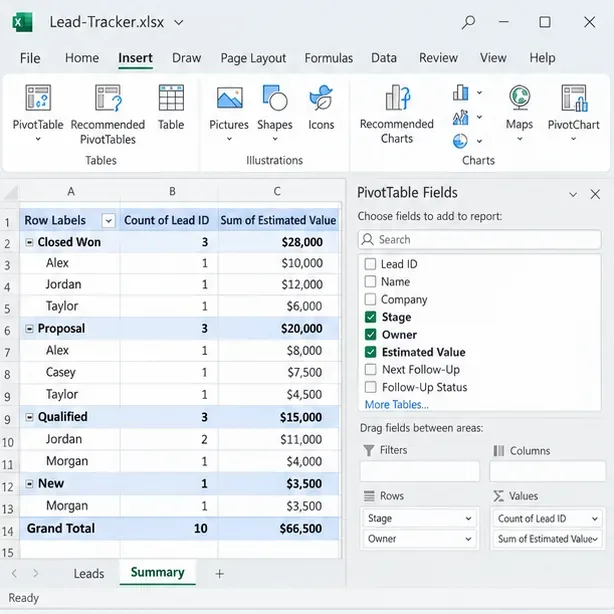
A small PivotTable can answer basic pipeline questions without building a separate dashboard application.
Keep the summary modest. A simple tracker should help you operate the sales process, not become a business-intelligence project. If managers need many dashboards, cross-object reporting, historical snapshots, forecast rollups, and consistent metrics across teams, the reporting requirements themselves may justify moving to a CRM or analytics platform.
Step 8: decide how the team will share and maintain the file
If more than one person edits the tracker, avoid emailing copies of the workbook back and forth. Microsoft supports co-authoring for compatible Excel versions when the workbook is stored in OneDrive or SharePoint Online. The current Microsoft guidance explains that collaborators can work in the same workbook and see one another's changes. See Microsoft Support: Collaborate on Excel workbooks at the same time with co-authoring.
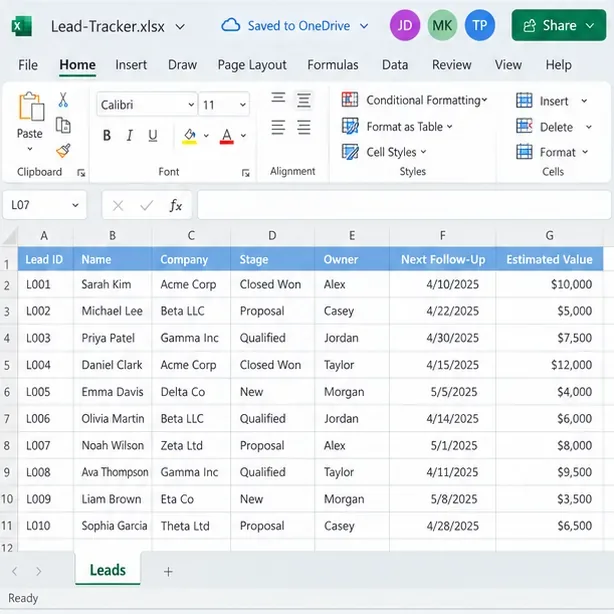
For multi-user editing, use a single cloud-hosted workbook rather than circulating separate file copies.
Co-authoring solves the “which file is current?” problem, but it does not turn Excel into a full sales system. Agree on operating rules: who can add stages, who owns data cleanup, when follow-up dates must be updated, and how often the team reviews stale leads.
Excel or CRM? Compare the tradeoffs by operating need
| Need | Excel is reasonable when... | A CRM is usually more appropriate when... |
|---|
| Process design | Your stages and fields are still changing frequently | Your process is stable and needs enforcement across a team |
| Data entry | A small number of people can follow simple rules | You need required fields, controlled forms, deduplication, or complex validation |
| Ownership | Lead assignment is manual and easy to understand | You need routing rules, queues, territories, or automatic reassignment |
| Activity history | Short notes and next-follow-up dates are enough | You need a durable timeline of calls, emails, meetings, tasks, and changes |
| Automation | Manual follow-up is acceptable | You need sequences, reminders, triggered actions, or workflow automation |
| Permissions | Most editors can see and change the same dataset | You need role-based access, restricted fields, or formal governance |
| Reporting | Filters and PivotTables answer the core questions | You need historical pipeline analysis, forecasts, multi-team dashboards, or governed metrics |
| Integrations | The tracker mostly stands alone | You need email, marketing, support, telephony, finance, or product data connected to sales records |
There is no universal lead-count threshold that tells you when to buy a CRM. A solo consultant with hundreds of simple prospects may still work efficiently in Excel. A ten-person sales team with fewer leads may need a CRM immediately if assignment, permissions, activity history, and automation are complex. Use operational friction rather than row count as the trigger.
What a CRM adds that this spreadsheet intentionally does not
Dedicated CRM products commonly add structured lead and opportunity records, activity histories, automation, access controls, assignment logic, and more advanced reporting. As one current vendor example, Microsoft documents automated lead assignment, duplicate detection, qualification, and scoring capabilities in Dynamics 365 Sales. See Microsoft Learn: Manage leads in Dynamics 365 Sales.
That does not mean you need those features today. It means the spreadsheet should help you discover which capabilities are actually worth paying for. If your team consistently struggles with one or two specific limitations—such as duplicate ownership, missed follow-ups, or lack of activity history—you can evaluate CRM products against those concrete needs instead of buying based on a long generic feature list.
A practical “CRM readiness” checklist
- Stay with Excel for now if one shared table, a few dropdowns, simple formulas, and a PivotTable cover the process reliably.
- Improve the spreadsheet first if the main problem is inconsistent field definitions, unclear stages, or weak follow-up discipline. Buying software will not automatically fix an undefined process.
- Start evaluating CRM options if reps frequently overwrite or duplicate records, ownership rules are becoming complicated, follow-up depends on memory, or managers cannot reconstruct what happened with a lead.
- Prioritize CRM implementation when permissions, auditability, integrated activity history, automated routing, or cross-system workflows are business requirements rather than conveniences.
Keep the Excel version as a requirements document
The best reason to build a simple lead tracker before buying a CRM is not merely to save subscription cost. It gives your team a concrete prototype of its sales process. The columns become candidate CRM fields. The dropdowns become proposed controlled values. The review routine exposes which reports matter. The places where the spreadsheet becomes painful reveal which automation and governance features you should demand from a CRM.
That makes the workbook useful even after you migrate. Instead of asking vendors, “What can your CRM do?” you can ask better questions: Can it enforce our stage definitions? Can it prevent or merge duplicates? Can it preserve activity history? Can it automate our assignment rules? Can we reproduce the pipeline views our managers actually use?
Build the spreadsheet to learn the process, not to avoid a CRM forever. If it remains simple and dependable, keep using it. If the manual work begins to control the team rather than support it, you now have enough evidence to buy the next system for specific, verifiable reasons.